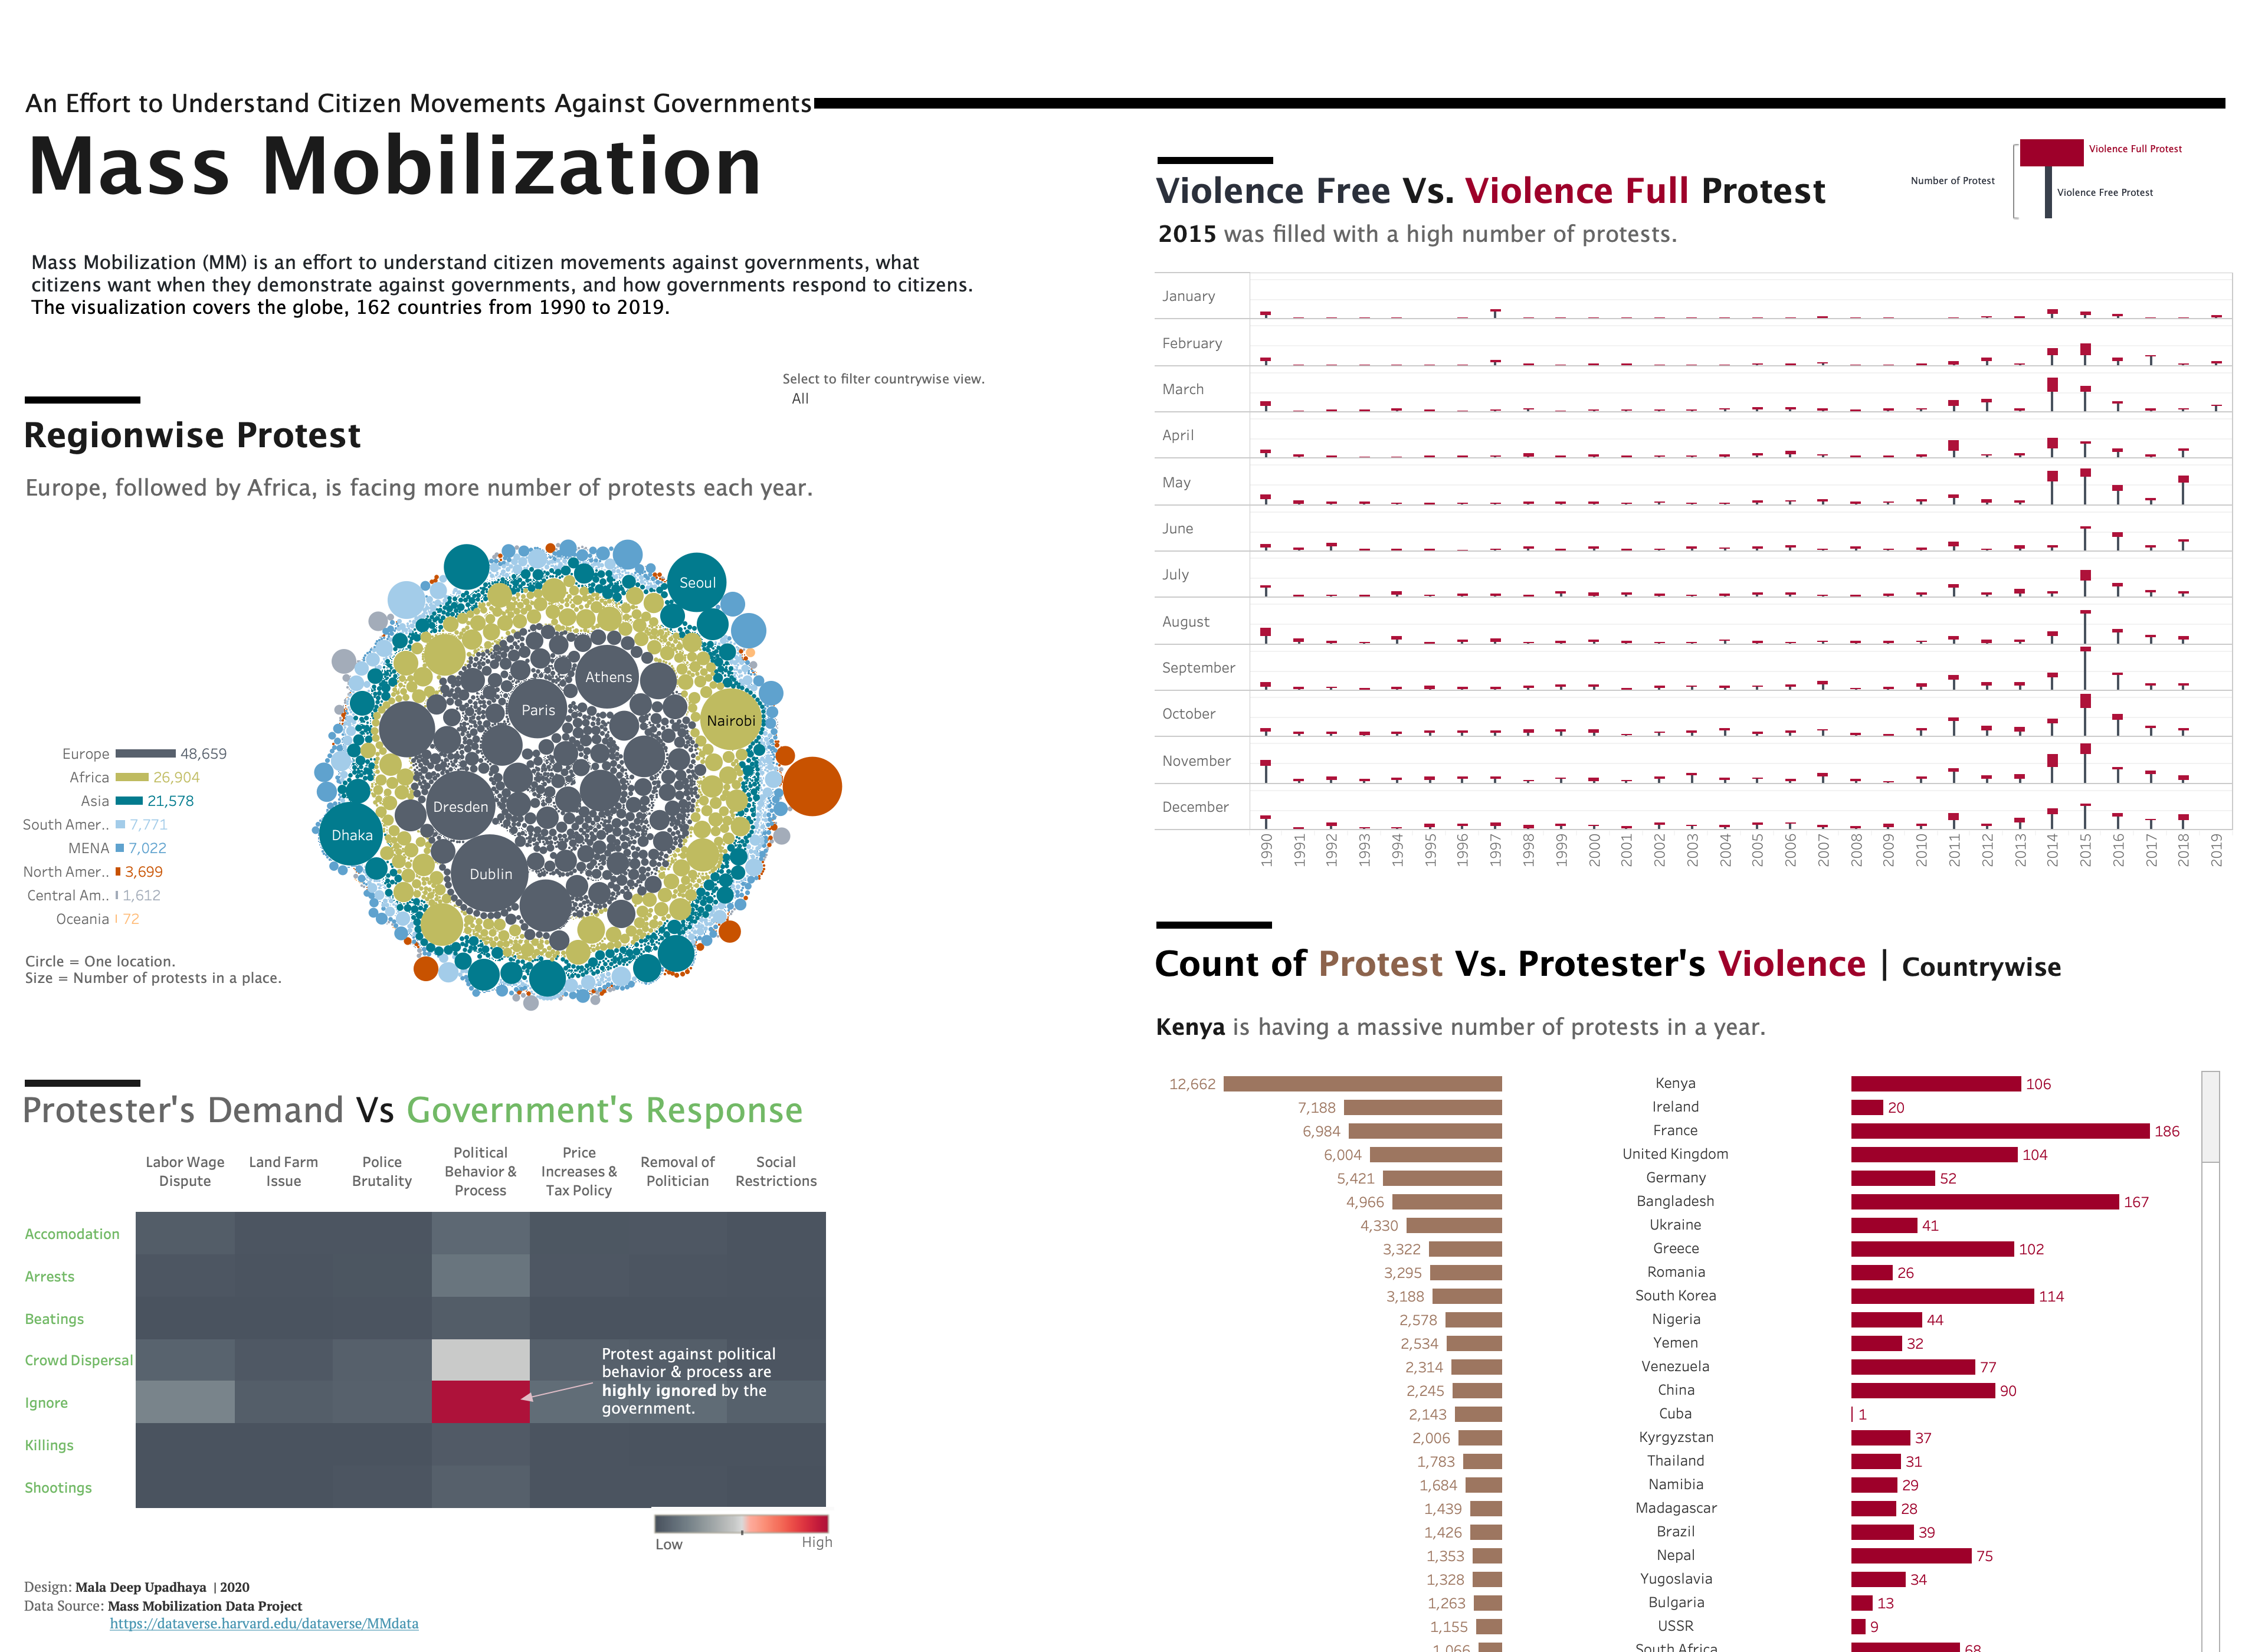
Recent Projects

Mass Mobilization

Protest against political behavior and process are highly ignored by Government. The Mass Mobilization (MM) data are an effort to understand citizen movements against governments, what citizens want when they demonstrate against governments, and how governments respond to citizens. Nightingale included this visualization in the 'Gale': A newsletter by Data Visualization Society. In addition to that, it was also featured in The Datavist newsletter.

Skin Prick Test Analysis in Allergic Rhinitis Patients using Decision Tree for Allergen Selection

The prevalence of allergic rhinitis has increased significantly globally over the last two decades. Detection of sensitizing aeroallergens plays a crucial role in the diagnosis and management of this troublesome disease. This study aims to investigate the spectrum of aeroallergens sensitization in patients with allergic rhinitis in a tertiary care hospital.

My responsibility was to perform data analysis, visualization, modeling of the Skin Prick test in Allergic Rhinitis using various data minings techniques.

"Express Your Feelings”: An Interactive Application for Autistic Patients

In this paper, we presented an application that aims to help autistic children interact and express their feelings with their loved ones in an effortless manner. The project's primary objective is to connect autistic children with their families and friends by providing tools that enable an easy way to express their feelings and emotions.

We presented the paper at International Conference on Human-Computer Interaction (HCII 2019).

Recent Blogs

How To Apply Gestalt Psychology Principles in Data Visualization

Published in Nightingale

Aoccdrnig to rseearch at Cmabrigde Uinervtisy, it deosn’t mttaer in waht oredr the ltteers in a wrod are, the olny iprmoatnt tihng is taht the frist and lsat ltteer be at the rghit pclae. The rset can be a toatl mses and you can sitll raed it wouthit porbelm. Tihs is bcuseae the huamn mnid deos not raed ervey lteter by istlef, but the wrod as a wlohe. — Abeer Hasanin 2015–2016

Data visualization is not just about depicting data into understandable and good-looking charts. Becoming good in data visualization requires the acquisition of foundational knowledge.

Build Your First Data Visualization Web App in Python Using Streamlit

Published in Towards Data Science| Featured in Weekly Roundup on Streamlit's community forum

Self-exploratory visualization using Streamlit visual expression’s power in less than 20 minutes.

Streamlit is an open-source Python library growing fast, making it easy to produce beautiful custom web-apps for data science and its subdomain. It is also an excellent tool that allows us to create highly interactive dashboards. The best thing about Streamlit is, it doesn’t require any knowledge of web development. If you know Python, you’re good to go!
I love streamlit because it brings some advanced models and visuals to a non-technical team.

Knowing These 5 HCI’s Principles Will Make Your Data Visualization Look Amazing

Published in Towards Data Science | Featured in Getting Started

A year back, I got an opportunity to read Human-Computer Interaction(HCI) at my university. There, I came to know about various human psyche principles presented in the domain. I was so excited to explore multiple such principles from the view of the Data Visualization.

Data visualization is a high bandwidth connection between data on a computer system and the human brain, facilitated by visual communication so by understanding how different psyche principles influence human behavior; we can design our products (Viz, Graphic, UI/UX, and so on.) to elicit specific responses and actions from our users.

Community Work

I live by the word,"Giving back to society is our Duty, not Charity. So, my goal is to empower people through education and community activities. Here are few glimpses of my community work.

Together celebrating Hacktoberfest 2019 at Dolpa, Nepal.

Student experiencing their first computer session in 2019 at Dolpa, Nepal.

Sharing the information about Sustainable Development Goal(SDG) to class 6-10 at Dolpa, Nepal.

Photoshoot after experiencing their first computer session in 2019 at Dolpa, Nepal.

Sub-Trainer for ubiquitous learning system, 2020.

Schoolgirl from Sinduli, Nepal learning how to create the website.

The boy is smiling profoundly on receiving the gift for answering maximum computer-related questions at Sindhuli, Nepal.

Student attending the program in title "Open Source" at Dolpa, Nepal.

Face behind establishing first computer lab of the district at Dolpa, Nepal.

Get In Touch

[email protected]
linked.com/in/maladeep
medium.com/@maladeep.upadhaya
github.com/maladeeptHub
Tableau Public